Google Analytics Certificate - Capstone Project
Project Repository: www.github.com/ahmedmostafa23/bellabeat
By: Ahmed Mostafa, Data Analyst.
My GitHub: www.github.com/ahmedmostafa23
My Kaggle
My LinkedIn
1-Ask and Plan
Who are BellaBeat?
Bellabeat is a manufactuer of smart health products for women. It is a global company since 2016. They own several physical stores, their own e-commerce channel, website and online retailers (amazon and such).
BellaBeat manufactures several products. The products are ordinary looking jewelry, you won’t realize they’re (too) smart!
- BellaBeat Leaf: smart bracelet, necklace or clip.
- BellaBeat Time: watch, but aso classic looking
- BellaBeat Spring: smart water bottle
Owners of BellaBeat devices enjoy the BellaBeat app: an app that receives data about vitals from smart devices about activity, sleep, stress, menstruation and the users’ habits.
BellaBeat membership subscription: 24/7 access to personalized guidance on the above problems, beauty and goals.
BellaBeat Marketing Strategy: - traditional (radio, billboards, print e.g. magazines, television), but they also extensively focus on digital
- ads in google search, google display network (the ads by google you find on pages, phone apps and etc.), youtube, active ig and fb pages, and twitter interactions
- they use google display network around key marketing dates
The CEO requires us to analyze the usage data of a device to gain insight on how users are already using said smart devices.
then she wants high-level recommendations on how said insight can inform the marketing strategy
To learn more about BellaBeat, you can visit their website.
The Scope of Work
My Role
- Me: junior data analyst
- position: marketing analysis team
- Company : Bellabeat, manufacturer of smart health products for women
- My task: analyze one of their product’s data
Analysis task: I will be analyzing data from customer’s use of the products.
-i.e. data collected by the device itself from customers, and sent to us.
Stakeholders: - My team and the Executive Team
- CCO (founder)
- Mathematician, executive and cofounder.
Deliverables: presentation and recommendations
The Analysis Problem
Problem: explore the use data of one of our health products and app to find insights, patterns and trends about the users’ usage to be used in making high-level marketing recommendations.
The dataset is data collected by the app/device.
Potential Questions that need to be answered:
- What do they do the most/least with their product?
- How long do they wear it everyday?
- What is the thing they enjoy most/least about their product?
- What features seem missing that we can add to the product?
- who are the people who use our product the most/least? age/nationality
- What is the most frequent time of day for usage?
- on a scale from 0-5, rate your experience with the product, why?
- How much running did they do this week? how long are their intervals?
- Are there any men using our products?
- what is the most unusual thing they do with the product?
- What is the average intensity of any exercise?
- Are those users’ health metrics within the healthy range?
Hypothesis: they use the product the most for running and tracking their menstrual period or pregnancy.
Required characteristics of the dataset:
- Population: there have been 100000 sold Bellabeat Leaf units from 2013 to 2017. I’m going to assume 100000 unique subjects.
with a margin of error of 10%, a confidence level of 10% I should have a sample size of at least 68 users. - Detailed non aggregate daily data of the usage, with intervals.
- Rating about features of the product, or the product as a whole.
- Also includes male users if possible.
- Women of different ages, race, nationality, and physically or mentally challenged women, as well as women of several income brackets
- preferably the data needs to be up to date as possible, with COVID-19 happening and all.
2-Prepare
1. Data Collection
- The dataset used was not going to be a dataset collected by BellaBeat devices themselves, it was recommended to use FitBit proxy data. I have searched the internet for proxy BellaBeat data, but only FitBit or apple watch data was available, and the FitBit data had more users.
- It is a proxy dataset collected by Amazon Mechanical Turk online survey 2 days In December 2016.
- The data was collected from 30 FitBit consenting users who gave their information about minute-level output for physical activity, heart rate, cadence, MET and sleep.
- This is 3rd party data. The users sent their data to Zenodo who sent to the Kaggle dataset owner Mobius, and the dataset was downloaded from Kaggle.
- It is unclear why the data was collected in the first place, but it is assumed that it was general analysis of smart health device activity, or as practice for students or Kaggle competitions.
- It is not possible to know whether all the people who replied are men or women, It is also impossible to know if any of them are lying or do not have a FitBit device at all, but that is unlikely.
2.Meta-Data
- The dataset has no metadata at all whatsoever. some of the fields were researched on the FitBit device API website, and by reading medical articles and definitions.
- 4 unimportant columns, or ones that could not be reserarched were removed from the dataset.
3. Software used
- The dataset is large. some files have 3.5 million records!
- It has been decided to use a database to store the data and do the analysis there. a database called FitBitData was created in PostgreSQL on my device.
- Further metadata has been added to the dataset, with the proper data types, precision, format, constraints and etc.
- Tables in postgreSQL database were created with the coressponding names, datatypes, constraints and etc.
4. Checking if dataset can still answer original questions.
-
By looking at the dataset I can see that there are 2 giant joined tables:
- by minute (sleep, calorie, MET, steps, and intensity)
- by day (steps, distance, active minutes and calories)
- There are also the HRV and Weight tables.
-
There are some interesting correlations worth investigating. i.e. the relation between calories, MET and intensity.
-
I also want to find the avg pace in steps/km for different levels of activity or speed of a person. I also want to see the relation between MET, steps vs sleep_value
-
Overall, the dataset has enough attributes to answer some of the questions. It is missing a few such as detailed activity, demographics, gender, job, menstruation cycle info. I can try to infer the nature of their job: is it sedentary? or active?
-
However, There is no way to tell if the data is accurate or incomplete. it did not mention how many records. But it did say 30 subjects, and they were 33 unique device_id values.
-
The dataset has one huge limitation though: It is from 2016! we’re in 2021 now. this is a huge problem, because in 2021 we have problems such as COVID-19 where people’s activity has highly changed.
-
The dataset is also not cited, There is also no clue about the creator of the dataset.
5. Data Ethics, Bias and Privacy
- All the users gave their consent to the data. there is no personal information whatsoever, so the data does even need anonymization.
- If the users of this dataset could be contacted, they should be contacted to inform them of our decision to use their data for our company’s marketing purposes, and our procedures.
- All of data is supposedly self reported so this decreases the possibility of some forms of bias. however, as stated above, there is no way to know age, gender, demographics or whatever.
3-Process
The data has been backed up to GitHub in the latest commit before I start the process stage and start cleaning the dataset.
1.Data Integrity:
- accuracy: there seems to be a problem with some of the fields. e.g. MET should be 1 if there is no exercise being done, but they all have 10
- consistency: The dataset has been made consistent by keeping the same fields with the same names everywhere in the database with the same type, format and precision
- completeness: the dataset is complete. nothing was lost during download or conversion from .csv files to the postgreSQL FitBitData Database.
2. Cleaning:
The tables will now be explored. the following will be done to each table:
- Constraints will be added to the tables and columns (enumeration, set membership, cross column, range, not NULL etc.)
- The tables will be checked for duplicate rows. if any are found they will be removed
- The tables will be checked for NULL values. if any are found they will be dealt with accordingly.
- Some columns maybe combined into a single column, other columns maybe processed or divided into several other columns
- String types will be checked for excessive whitespace, and removed if any.
Let’s get started with each table!
-
Weight table:
- There are no duplicate records
- There are no null values
- Constraints have been added to weight_kg, bfr, bmi and height_m to be >= 0, and bfr <= 1
- Device_id to check that it is exactly 10 characters long.
- Split the date_of_weigh column into 2 columns: date and time
- Added NOT NULL to date and time columns
- All the fields are numeric and typed perfectly. so no need to remove white space or get the value of columns.
- No records have been deleted from the table.
-
DailySleep Table
- There are no NULL values
- There are 3 duplicate values. they have been removed
- A constraint for the sleep_value column has been set to either be 1, 2 or 3.
- device_id check to be exactly 10 characters long
- minutes_in_bed check to be >=0 and <= 1440 (because you can’t spend negative minutes, or greater than a whole day in a single day)
- minutes_asleep check to also be >=0 and <= minutes_in_bed.
- Since all of the days start at 00:00:00, I’m just going to create a date column without the time, and discard the day_start column.
-
MinuteSteps Table
- device_id check 10 characters long.
- Table has no duplicate rows.
- Table has not a single NULL cell.
- minute_start will be split to 2 columns, date and time. both are set to NOT NULL.
- minute_start column has been deleted.
- Constraint to the steps column so that it can never be negative.
-
SecondHRV Table
- Table does not have a single NULL cell.
- LENGTH(device_id) = 10 constraint
- HRV check >= 0
- second_start will be split into date and time columns. both set to NOT NULL.
-
DailyActivity Table
- Constraint LENGTH(device_id) = 10;
- day_start column has been replaced with “date”
- Table has no duplicates and not a single NULL cell.
- 331/940 records do NOT add up active distances to total distance:
- Corrected columns where the manual sum of active distances - total_sum >= -0.05km, so that the total_sum will be the sum of them.
- Created a logged_distance column such that for columns where the manual sum of the active distances - total_sum < -0.05km, the difference goes into the logged_distance column.
- Now, constrain the table such that
- active_distance + logged_distance = total_distance
- the sum of all active minutes SHOULD be = 1440. because a single day has 1440 minutes and sedentary minutes sitting down or sleeping. so if a person does not add up to 1440 minutes a day, it means he has taken his FitBit device off for a part of the day. create a new column that has the time where the user took off his fitbit.
- Now, constrain the table such that active_minutes + not wearing = 1440
-
MinuteIntensity
- Table does not have a single NULL cell.
- No duplicate rows
- The minute_start column will be divided into date and time, and they will be set to NOT NULL.
- device_id constraint length = 10
- intensity must have a set membership of either 0,1,2,3
-
MinuteMET
- Table does not have a single NULL value.
- Table has no duplicate records.
- constraint to device_id is length = 10
- minute_start will be divided to date and time columns.
- met will be constrained to always be >= 1
- There seems to be a problem here. some met values are 0. which violate the constraint. 7 rows that violate the constraint have been deleted.
- The numbers here do not make sense. the value of MET should be 1 if the person is sedentary while lying down or completely idle. and 16 if the user is an Olympic athlete who can see the finish line. most people in the table have 10, and some people have 100+!! The only logical case is that the numbers in the table are multiplied by 10. because most people have 10, when they should have 1. So all MET values were divided by 10.
- Some values after division would be <1, and would violate the constraint. Only a single record violated that constraint, it has been deleted.
-
MinuteSleep
- table has no NULL values
- There are 543 duplicate records!
- minute_start will be divided into date and time cols with NOT NULL
- device_id length constrained to 10
- sleep_value constrained to {1,2,3,}
-
MinuteCalories
- Table has no NULL values, and no whole duplicate records.
- constrained device_id length = 10
- Split minute_start into date and time. both constrained to NOT NULL.
- constrain calories to always be > 0
3. Backup
- Before proceeding with the Analysis phase, the database has been backed up
4-Analyze
In this phase, 3 types of analysis will be done:
- Exploratory analysis:
- Which categories/users/date/time have very low count compared to others, what am I going to do with them?
- Summary of each column (aggregate: min, max, sum, count, unique count, percentiles and outliers)
- Which categories/users have very low count compared to others, what am I going to do with them?
- Investigate any anomalies/outliers found.
- do I need to divide the dataset into subsets? e.g. active vs. inactive? anomalies and outliers?
- Checking for correlations
- sleep vs calories or met or intensity
- calories vs steps or intensity or met
- Answering the questions using data
1. Exploratory Analysis
-
Numerical columns could be summarized with min/max/sum/NOT NULL count/percentiles and outliers.
-
while categorical (ordinal or nominal) are summarized as count, NOT NULL count, unique count, and the frequency of each category.
-
while date/time columns will get min/max and count NOT NULL.
-
Strategy: join the minutes tables all into a “minute table”. Since they all have 33 unique devices and almost the same number of rows, they will be INNER JOINed to get a full record (except the sleep table, it has a lot less records, so will be LEFT JOINed)
column name data type sub type device_id categorical nominal date date N/A time time N/A datetime timestamp N/A cadence numerical discrete sleep categorical ordinal calories numerical continuous met numerical discrete intensity categorical ordinal -
Sleep
- From the exploratory results, It can be seen that the MinuteSleep table seems to only have records when the person is actually sleeping and when wearing the device. 10 device_id were missing from the MinuteSleep table. which indicates that a portion of the users 10/33, do not wear the device when sleeping.
- There is no relation between sleep_value and met or calories or intensity or steps. However, it is strange that some people have a sleep value of 1 (asleep) and they have a very high MET or calorie count. people asleep walking < 20 steps per minute, This indicates the device incorrectly measures activity, or in an extreme scenario: people are sleep walking! Thus, There is no way to predict whether a person is asleep or not using the other metrics. the sleep table can only be used to predict what time users wake up and go to sleep. This is a limitation of the dataset, because the not all users have worn the device while sleeping.
-
Investigating correlations between MET, intensity, steps and calories
- calories/min depend on the level of activity, weight, height, age, pregnancy and etc. and thus varies greatly from person to the other, so calories as a number is not good metric for this investigation. however, we maybe able to find the baseline calorie for each user (at MET=1, but MET IS the ratio ratio, so MET will be used instead)
- One thing should be for sure: at MET =1, steps should be =0, intensity =0 and calories = baseline. records where that is not satisfied (below <500 rows) have been removed from the analysis.
- The relation between met and percentage baseline is linear, but unit stepped with a few “intersections”. i.e. each MET range covers a range of percentage baseline calories. which seems to tell that MET is by definition, the baseline calories ratio. and that MET is approximated to be whole numbers by the device.
- The relation between cadence and baseline calories seems to be linear but is clustered heavily around the trendline. indicating that the percentage baseline of calories depends on factors other than just walking, but perhaps from user to user or other kinds of activity. i.e. the device users don’t just walk or run.
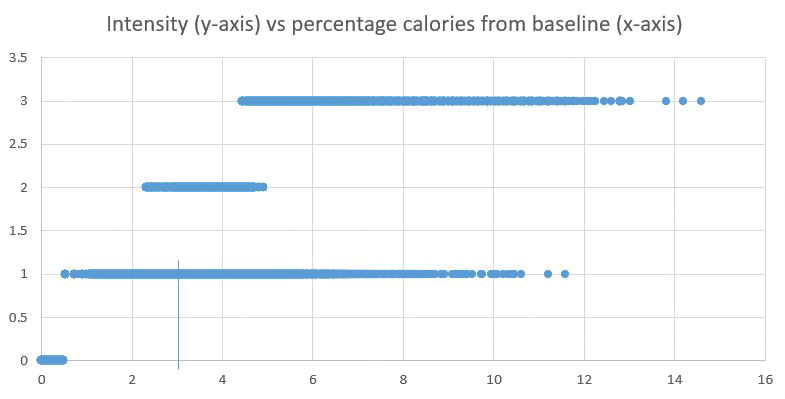
- For intensity, there seems to be something quite strange. people having baseline calories of 10+ have an intensity of just 1! what should happen is that MET >3 should be at Intensity > 1! this maybe an indication that the device is measuring incorrectly.
-
DailyActivity
- Only records with active minutes > 0 and active distance > 0 will be studied. a new column called average speed will be created which is distance/time in km/h
- light ones: 855 records are not zero. no time but no distance. in fact, 99th percentile is 1.86 km/h. thus I will let moderate be anything > 1.86km/h
- moderate ones: 453 records have speed of > 1.86. with the 99th percentile at 4.2 km/h. Thus active will be defined as anything > 4.2 km/h
- The interesting finding here is that different users and minutes can have the same level of activity but vary greatly in speed. which means that either the device is wrong, or that not all users have running or walking as their activity. Unfortunately, there is no other way to know what their activities are.
-
Answering the Questions!
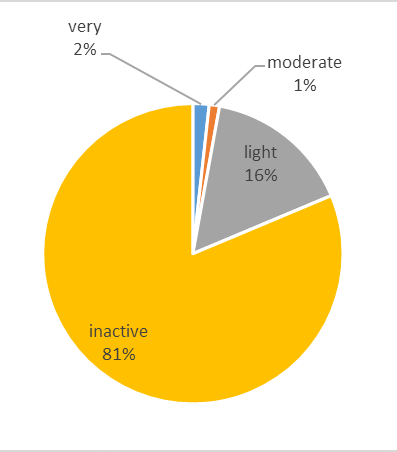
- Q1: What do they do the most/least with their product?
–> The average intensity level will be averaged for each user, for each day of the study. it has been found that the average user spends 81% of his device wearing time being sedentary, 16% doing light activity, 1% doing moderate activity and 2% doing very intense activity. of that sedentary, sleeping is included.very moderate light inactive 1.7% 1.2% 15.8% 81.3%
-
Q2: How long do they wear it everyday?
- For the 31 days of the dataset, less than 25% of days were worn below 1000 minutes (70% of the day), while the median is at 1440 which is the whole day
- only 4/33 users wore the device for less than 68% of the month. with the least worn times being at night
-
Q3: What is the thing they enjoy most/least about their product?
- 9/33 users do not wear their device while sleeping (and 6 more could be excluded for wearing for less than 5 days). so we can conclude that users dislike most to sleep with the device. other than that,
-
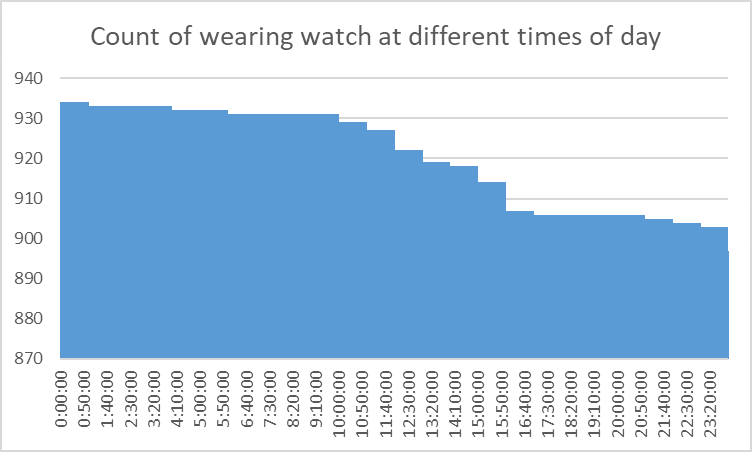
Q4: What is the most frequent time of day for usage?
- Most people wear their device most of the day, but in general, people who do take off their devices, take them off from 10:00am to 4:00pm, but they seem to put the device back on at 12:00, which is extremely strange and needs further investigating.
-
Q5: How much running did they do this week? how long are their intervals?
- It is difficult to say whether the users ran or not. because very active for example should have users faster than 4.2km/h, but there are slower users. so are they running, or are they doing something else
- It can be attempted to guess how many users are running based on their speed and intensity. at a certain pace, as discussed in the above correlations.
| stat | very active minutes | moderately active minutes |
|---|---|---|
| avg | 35.1 | 22.7 |
| 25th | 9.3 | 9 |
| 50th | 27 | 16 |
| 75th | 50.8 | 29 |
-
neglecting light activity at speeds <1.86km/h which is not running nor park strolling, It can be seen that the average activity time for very active runners is 35.1minutes/day, while for moderately active runners is 22.7minutes/day, with 50% of runners running >16 minutes a day.
-
Q6: Are those users’ health metrics within the healthy range?
-
The only indicator of health is the HRV in the SecondHRV table. There is a limitation of only 14 users have recorded their HRV, it is needed to encourage more users into measuring this statistic, which is arguably the most important. it seems that the users do not have any idea how important it is. It was found that the baseline night (7:00am to 10:00pm, where they typically go to sleep) and day time for people. They’re all within 58-95, and that day time < night time. so the people are fairly healthy! especially that the 95th percentile is at 113 and 1st percentile at 48. are still within the healthy range of 40~200.
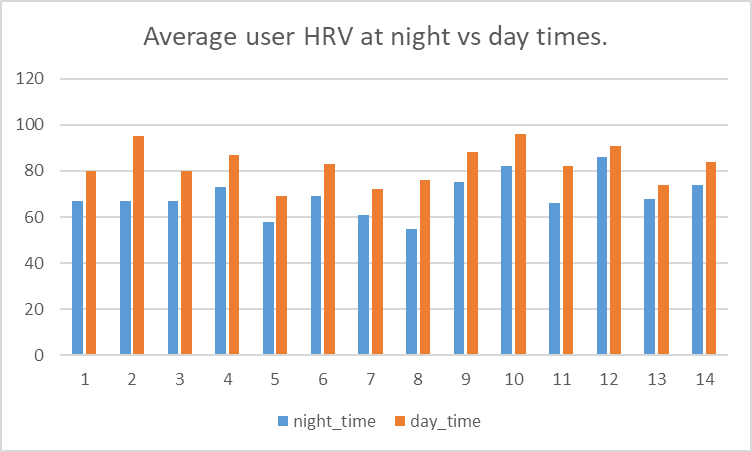
Metric min max avg 1st 5th 10th 25th 50th 75th 90th 95th 99th Value 36 203 77 48 54 57 63 73 88 102 113 148 -
-
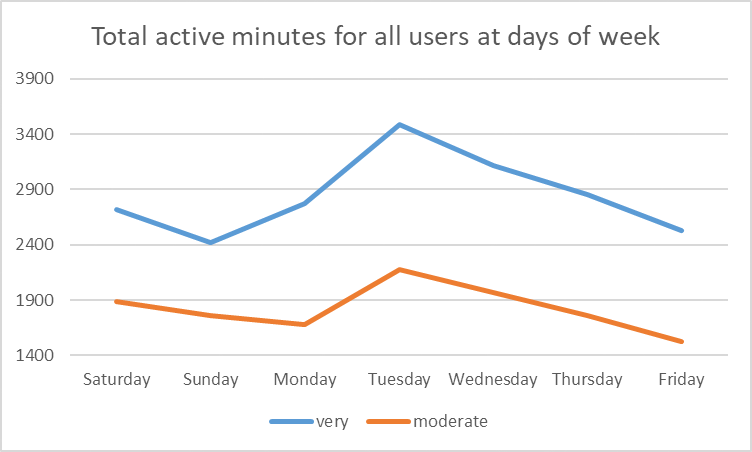
Q7: do weekends affect the performance and sleep?
- it can be seen that the least very active day is Sunday, a weekend day, is the lowest day of the week.
- For moderate activity, Friday is the least (which is just before the weekend!), while Tuesday is the highest.
- For sleep, only consider users with >2 records. the average sleep on days is highest on Saturday and Sunday, but lowest on Monday and Thursday.
- for activity in general, Sunday is the least, and Tuesday is the most.
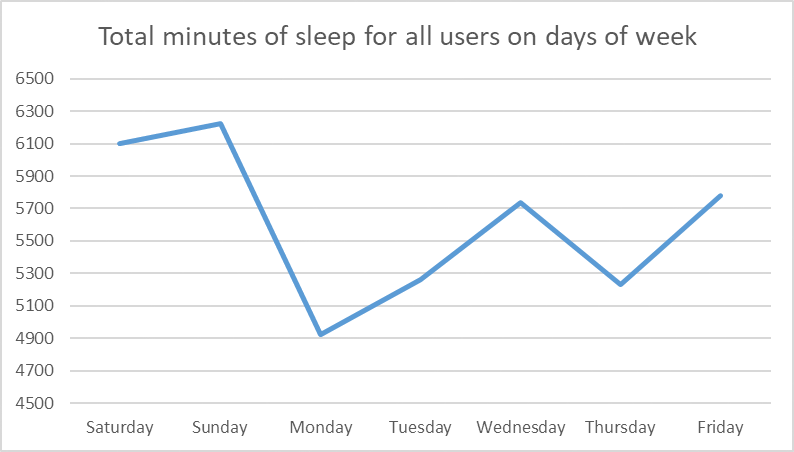
We can conlude that on weekends, especially Sunday, users tend to relax and do the least activity, and sleep the most.
-
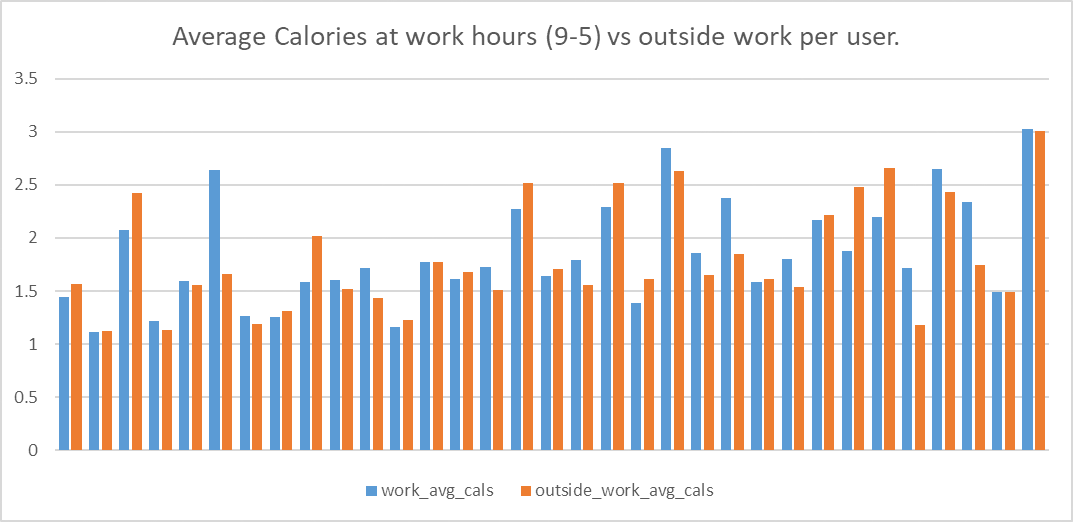
Q8: is their job sedentary or active?
-
To answer this, look at the avg MET for each user from 9:00 am to 5:00 pm for each day, vs outside that time (except from 10:00pm to 7:00am, where they are supposedly sleeping)
-
some users have work met > none work, and others have the opposite, others have the same, however the avg values (for MET >2 records) are quite low. most users have a sedentary job.
-
-
Q9: do they wear the device while sleeping?
- 10/33 users did not wear it.
- the ones who did wear it, I expected ~12500 records for 6.8h of sleep every night. only 10/24 have >10000 records for the whole month. it could be due to lack of sleep, but is unlikely and needs further investigation.
-
Q10: do they still wear it on the weekends?
- the least worn day was Monday, followed by Sunday, Saturday and Friday
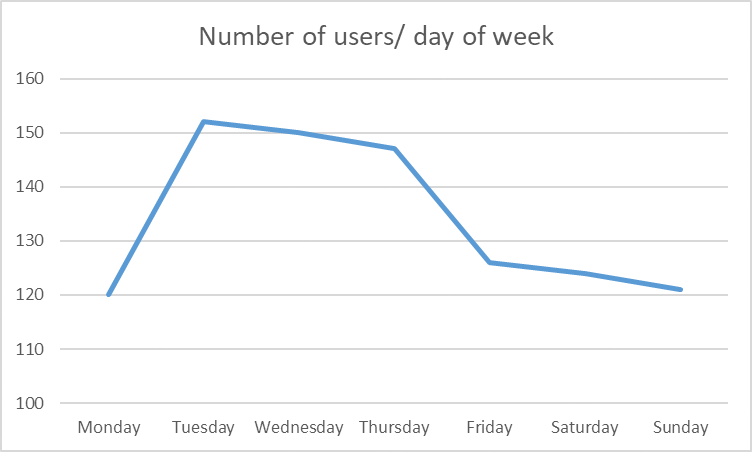
- the day with the lowest average minutes worn is Thursday then Sunday then Saturday, and the most is Monday.
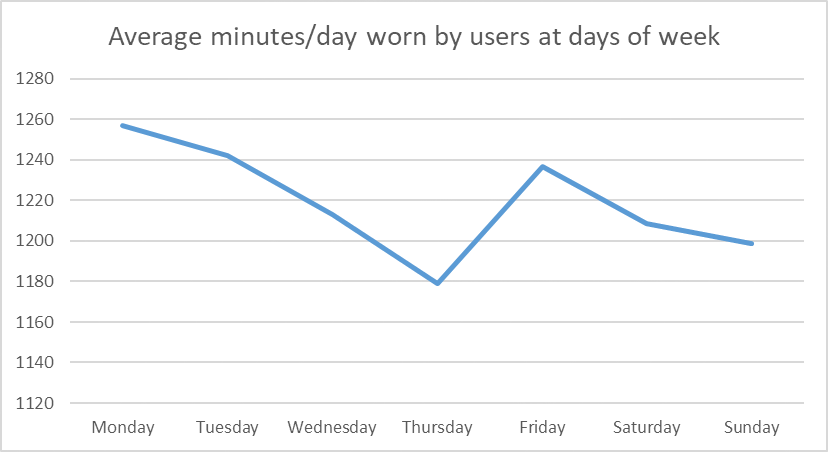
–> so less people wear the device on Monday and closely followed by the weekend. and when people actually put on the device on the weekends, they use it for the least time
- the least worn day was Monday, followed by Sunday, Saturday and Friday
-
Q11 :when do they wake up and go to sleep?
-
they start waking up at 6:00 am and go to sleep at 9:30pm.
perhaps in the future the company can add a feature to know exactly where each user woke up. e.g. by allowing the user to set an alarm on the device, and record when the user turns off his device.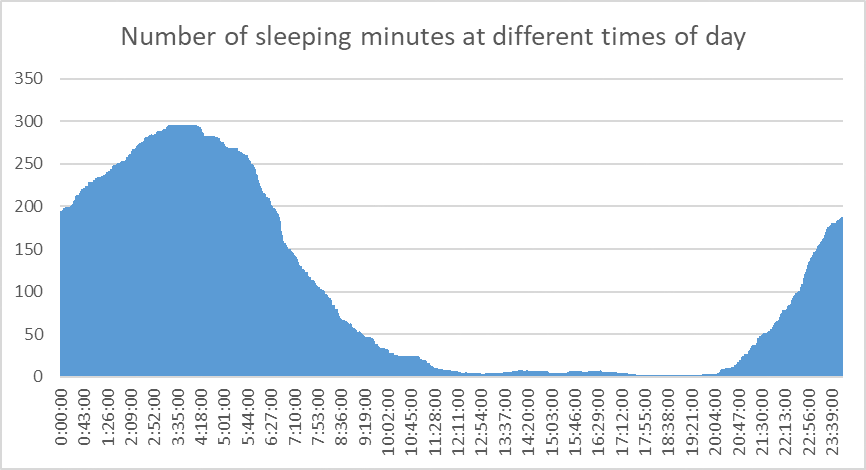
-
5-Act
Now that the analysis is complete, it is time to make recommendations that will drive data driven decisions for BellaBeat’s marketting strategy
-
Investigate why users do not sleep with the device, or add some features that encourage sleeping with it. A quick google search shows that smart devices emit radiation, and is why users od not sleep with it. that could be the cause!
-
Because we don’t know when users exactly fall asleep, Add a feature to the app or device e.g. similar to Netflix’s “are you still watching?”, or prompt them for their usual sleep schedules and concentrate on that time.
-
Ask the users on the device or app to enter what the activity they are doing is, or what is their job or the nature of their job. if the users do not respond to these, a point system could be set up to entice them to input their information.
-
Have the device push them to their goals on the weekend, or provide a fun alternative that they can enjoy while resting. provide them with a weekly summary so they can feel good about themselves. The company can also add features to the device that sends a message on a weekend e.g. “it’s the weekend! enjoy getting uninterrupted sleep” or something similar.
-
Sedentary jobs are known to have adverse health effects because of sitting for too long or staring at the screen. it could be nice to add some features to remind the user to take a break or stare away from the screen or get up and stretch or etc.
-
Add features or messages to encourage them to use the device on the weekend, i.e. to help them relax.
-
Do not let the device approximate MET. it produces misleading data.
-
Have HRV be the main focus of the device/app, and make that the main marketting feature. because HRV is truly the only metric that the device can use to predict whether a user is acutally healthy.
Appendix
Here you will find all of the PostgreSQL queries that were written to answer the questions or retrieve particular data
SQL syntax for removing whole duplicate records from any table “table_name”
 WITH everything AS
    DELETE FROM table_name
    RETURNING *
 )
 INSERT INTO table_name
 SELECT DISTINCT *
 FROM everything;
SQL syntax for checking for any cells in any table "table_name" that have NULL values
 SELECT *
 FROM table_name
 WHERE
	 NOT (table_name IS NOT NULL);
SQL Syntax for summarizing a numerical column "col_name" in a table "table_name":
SELECT
    MIN(col_name),
    MAX(col_name),
    AVG(col_name),
    COUNT(*),
    PERCENTILE_DISC(0.01) WITHIN GROUP (ORDER BY col_name),
    PERCENTILE_DISC(0.05) WITHIN GROUP (ORDER BY col_name),
    PERCENTILE_DISC(0.1) WITHIN GROUP (ORDER BY col_name),
    PERCENTILE_DISC(0.25) WITHIN GROUP (ORDER BY col_name),
    PERCENTILE_DISC(0.5) WITHIN GROUP (ORDER BY col_name),
    PERCENTILE_DISC(0.75) WITHIN GROUP (ORDER BY col_name),
    PERCENTILE_DISC(0.9) WITHIN GROUP (ORDER BY col_name),
    PERCENTILE_DISC(0.95) WITHIN GROUP (ORDER BY col_name),
    PERCENTILE_DISC(0.99) WITHIN GROUP (ORDER BY col_name)
    FROM table_name
    WHERE
  	  col_name IS NOT NULL
SQL Syntax for summarizing a date/time column:
SELECT
	 MIN(col_name),
	 MAX(col_name),
	 COUNT(*)
FROM table_name
WHERE
	 col_name IS NOT NULL;
SQL Syntax for summarizing a categorical column:
SELECT
	col_name,
	COUNT(*)
FROM table_name
GROUP BY
    col_name
Question 1:
--Question 1
 SELECT
     CAST(AVG(very_active_minutes) AS INT) AS "very",
     CAST(AVG(moderately_active_minutes) AS INT) AS "moderate",
     CAST(AVG(lightly_active_minutes) AS INT) AS "light",        CAST(AVG(sedentary_active_minutes) AS INT) AS "inactive"
 FROM DailyActivity;
Question 2 and 4, count of number of records per user:
WITH Minute AS (
     SELECT *
     FROM MinuteCalories
     INNER JOIN MinuteMET USING(device_id, date, time)
     INNER JOIN MinuteIntensity USING(device_id, date, time)
     INNER JOIN MinuteSteps USING(device_id, date, time)
     LEFT JOIN MinuteSleep USING(device_id, date, time)
)
SELECT
	device_id,
	COUNT(*)
FROM Minute
GROUP BY
	device_id
Question 2 and 4, count of number of records by day
WITH Minute AS (
    SELECT *
    FROM MinuteCalories
    INNER JOIN MinuteMET USING(device_id, date, time)
    INNER JOIN MinuteIntensity USING(device_id, date, time)
    INNER JOIN MinuteSteps USING(device_id, date, time)
    LEFT JOIN MinuteSleep USING(device_id, date, time)
)
SELECT
	date,
	COUNT(*)
FROM Minute
GROUP BY
	date
ORDER BY
	date ASC;
Question 5:
/*This is a file that fetches records for users with both active minutes > 0, and active distance > 0 for all days of the study, and calculates their speed. it should be filtered so that it only produces runners. for moderately active speed is (1.86-4.2)km/h, for very active it is > 4.2km/h*/
SELECT
    lightly_active_distance,
    lightly_active_minutes,
    CAST((lightly_active_distance*60/lightly_active_minutes) AS NUMERIC(3,1)) AS "lightly_active_speed"
FROM DailyActivity
WHERE
	lightly_active_distance > 0
	AND lightly_active_minutes > 0
ORDER BY
	1 ASC;
Question 6:
WITH day_avg AS (
    SELECT
	    device_id,
	    CAST(AVG(HRV) AS INT) AS "day_avg_hrv"
	FROM SecondHRV
	WHERE
		time BETWEEN '07:00:00' AND '22:00:00'
	GROUP BY
		device_id
), night_avg AS (
	SELECT
		device_id,
		CAST(AVG(HRV) AS INT) AS "night_avg_hrv"
	 FROM SecondHRV
	 WHERE
		 time > '22:00:00' OR time < '07:00:00'
	GROUP BY
	     device_id
)
SELECT
	d.device_id,
	day_avg_hrv,
	night_avg_hrv
FROM day_avg AS "d"
FULL OUTER JOIN night_avg AS "n" USING(device_id)
Questions 7&10 (the weekend), Helping function:
/*The function EXTRACT(DOW FROM date) returns the days of the week as a double precision numerical type such that Sunday = 0, and Saturday = 6. I have created the following function to take that number, and return the name of the day of the week for me, so that my life becomes easier.*/
CREATE OR REPLACE FUNCTION fn_downumber2name(dow double precision) RETURNS TEXT AS
$$
    SELECT (
	         CASE
	         WHEN dow = 0 THEN 'Sun'
	         WHEN dow = 1 THEN 'Mon'
	         WHEN dow = 2 THEN 'Tue'
	         WHEN dow = 3 THEN 'Wed'
	         WHEN dow = 4 THEN 'Thu'
	         WHEN dow = 5 THEN 'Fri'
	         ELSE 'Sat'
	         END
	        )
 $$ LANGUAGE SQL
Questions 7&10:
 /*This SQL code will group by days of the week using the above function.*/
 SELECT
     fn_downumber2Name(EXTRACT(dOW FROM date)) AS "day_of_week",
     COUNT(*)
 FROM DailyACtivity
 GROUP BY
	 fn_downumber2name(EXTRACT(dOW FROM date))
Question 8:
 /*This file will compare the MET at work hours against the avg MET outside work hours (9:00 am to 5:00pm)*/
  WITH Minute AS (
	  SELECT *
	  FROM MinuteCalories
	  INNER JOIN MinuteMET USING(device_id, date, time)
	  INNER JOIN MinuteIntensity USING(device_id, date, time)
	  INNER JOIN MinuteSteps USING(device_id, date, time)
	  LEFT JOIN MinuteSleep USING(device_id, date, time)
 )
 SELECT
	 time,
	 CAST(AVG(MET) AS NUMERIC(3,1)) AS "work_met"
 FROM Minute
 WHERE
	 time BETWEEN '09:00:00' AND '17:00:00'
 GROUP BY
	 time
 ORDER BY
	 1 ASC;
Question 11:
 /*This file will give me a count of sleep records by time of day for all users in all days*/
 SELECT
     time,
     COUNT(*)
 FROM
	 MinuteSleep
 WHERE
	 EXTRACT(SECOND FROM time) = 0
 GROUP BY
	 time
 ORDER BY
	 time ASC;